Comparing Hex vs. Looker
Thinking of switching from Looker to Hex? Modern data teams make the switch to Hex to power faster and deeper insights with AI.
Why companies switch from Looker to Hex
Quick questions. Deep analysis. All in plain language.
Looker requires non-technical users to grasp dimensions, measures, and Explores—just to answer simple questions.
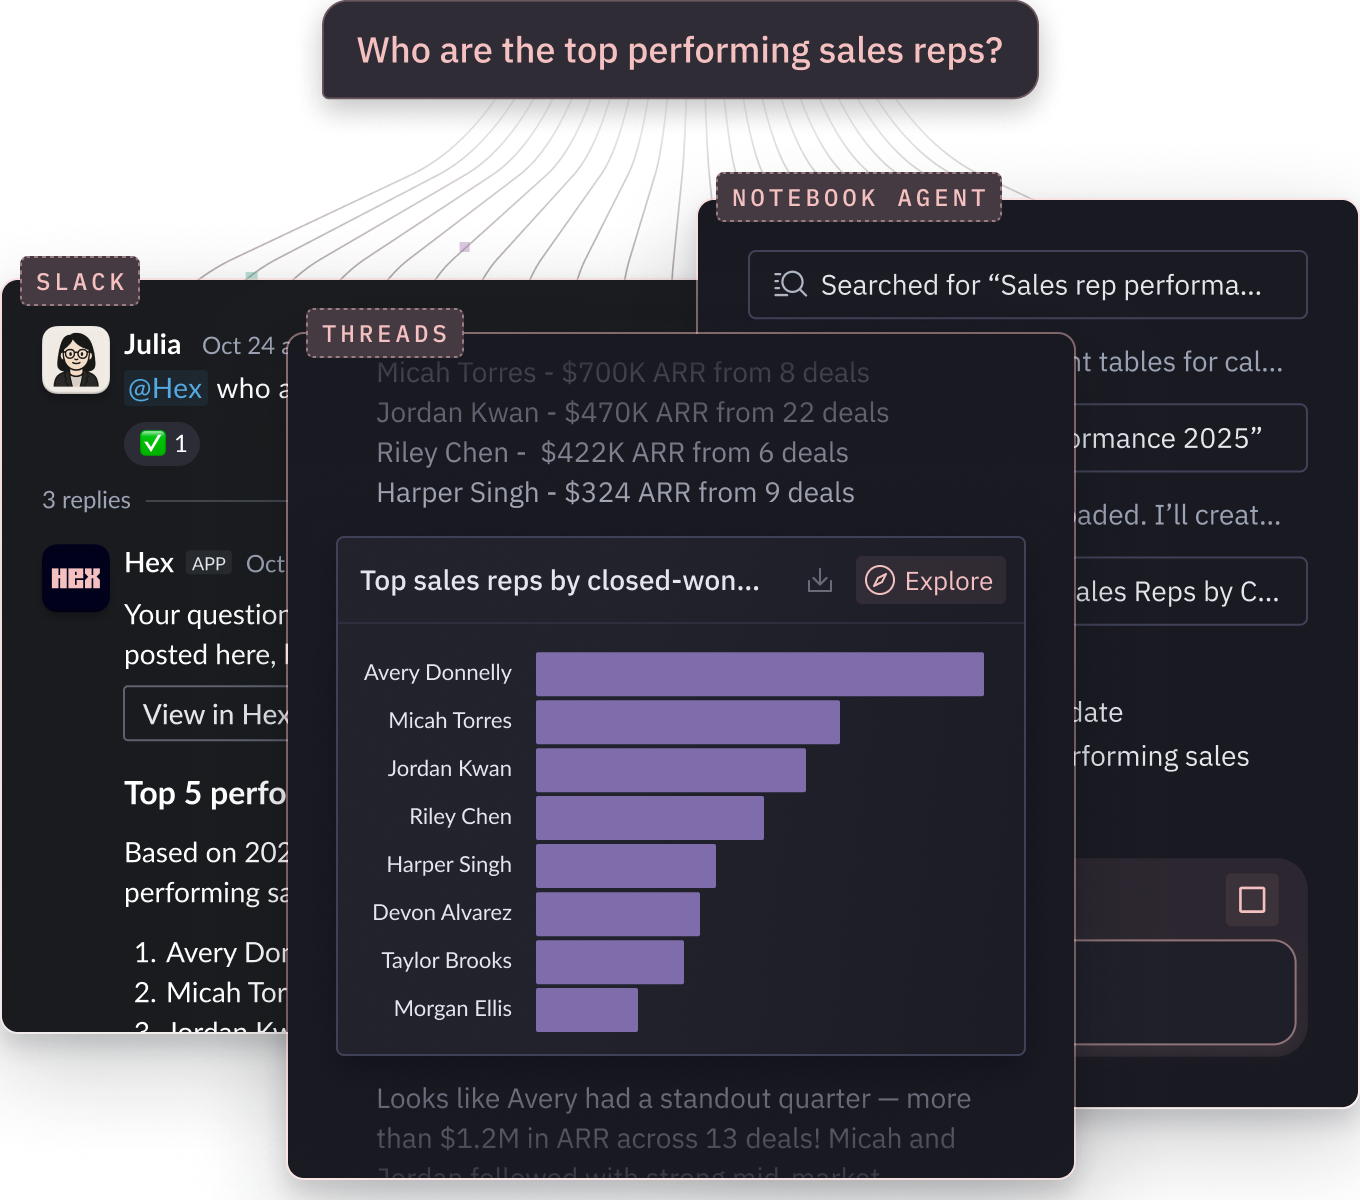
With Hex, any question can be explored in plain language. Business users self-serve through Threads, while data teams can explore code-based analysis with the Notebook Agent.
| Features | Hex | Looker |
|---|---|---|
AI self-serve Business users self-serve in plain language | Hex Threads lets users ask questions in plain language, iterate with follow-ups, and explore answers without knowing SQL or the model. | Looker Conversational Analytics supports simple, one-shot natural-language questions, but lacks multi-step reasoning. |
AI code-based analysis Generate and refine SQL, Python, and logic with AI | Hex Notebook Agent assists with writing and refining SQL, Python, and charts; reasons through multi-step logic and debugging. | Looker No AI support for code generation, debugging, or building analyses. |
Seamless collaboration Continuity of context between business users and data teams | Hex The seamless handoff from a Thread to a Notebook keeps full context and continuity for inspectability and extension. | Looker Inspecting underlying logic or extending analysis is limited to Looker’s Explore interface. |
No-code exploration Spreadsheet, drag-and-drop based analysis | Hex Supports no-code exploration with tables, pivots, and charts for drag-and-drop analysis. | Looker Supports GUI-based exploration of modeled data through Explores, filters, pivots, and visualizations. |
From static dashboards to advanced data apps
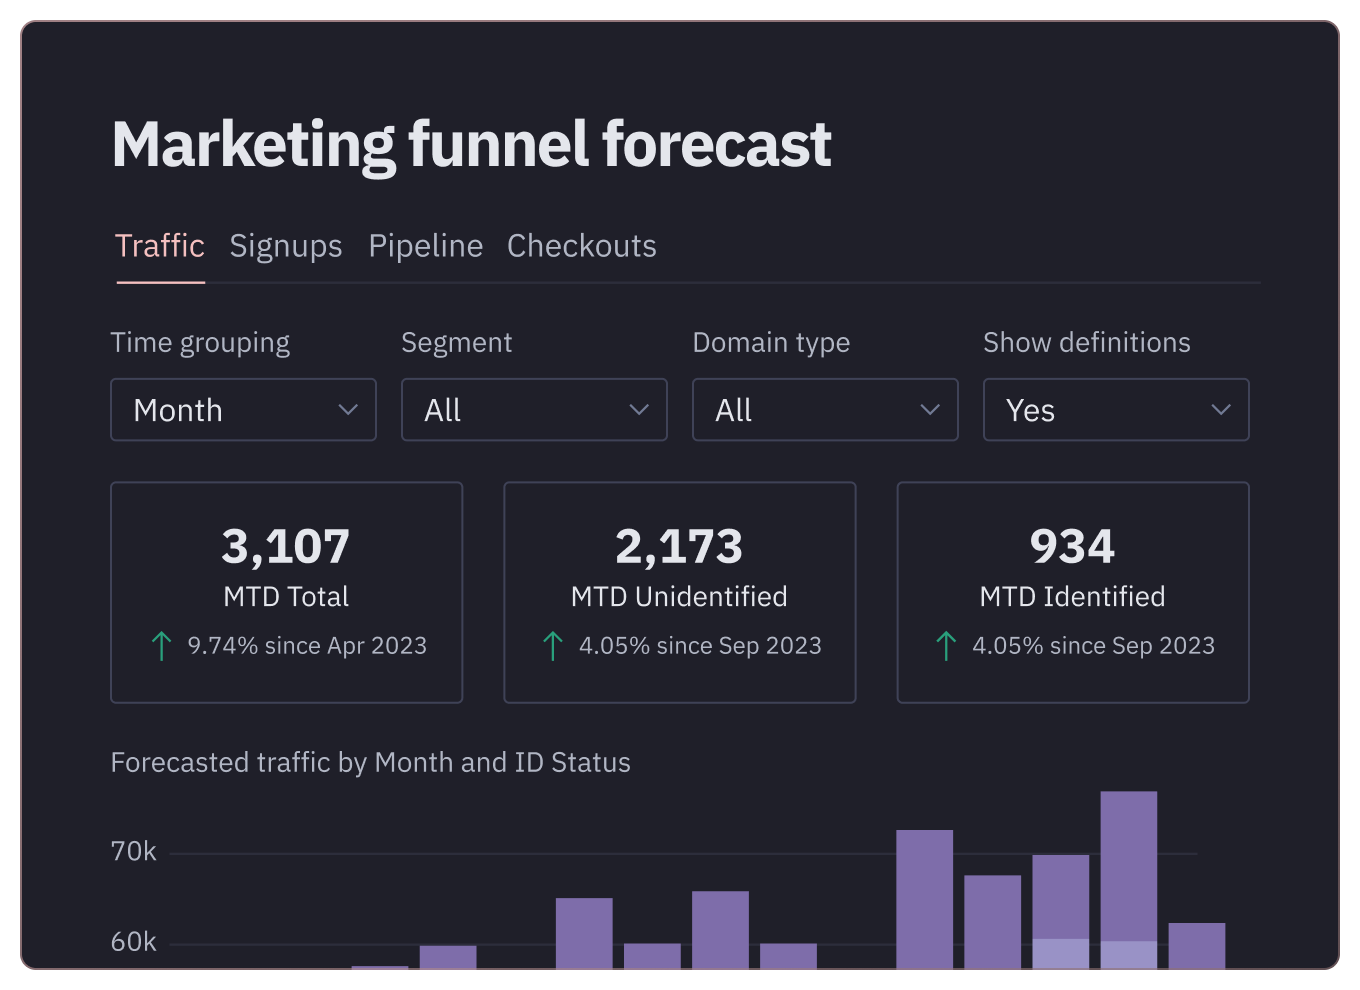
With data apps in Hex, you can turn code-based explorations, like forecasting, what-if models, and root-cause analysis, into interactive experiences for end users.
While Looker dashboards are fine for monitoring KPIs, they don’t support complex computation or advanced interactivity.
| Features | Hex | Looker |
|---|---|---|
Interactive apps Dynamic exploration beyond dashboards | Hex Data apps include inputs and controls (dropdowns, sliders, date pickers, text boxes) enabling truly interactive analysis. | Looker Dashboards are static with basic filter controls; no input-driven logic or custom interactions. |
Advanced analytics Computation and modeling built in | Hex Data apps run live Python and SQL, enabling forecasting, what-if scenarios, simulations, and other advanced analyses directly in the app. | Looker Dashboards display static query results. No embedded computation, modeling, or parameter-driven logic. |
Reporting dashboards Standard KPI and metric tracking | Hex Build dashboards using no-code charts or full Python visualization libraries. | Looker Create dashboards with customizable, Explore-powered visualizations based on LookML models. |
Flexible governance, unconstrained exploration
LookML provides governance but locks you into a proprietary modeling layer. Every new question triggers edits, reviews, and redeploys.
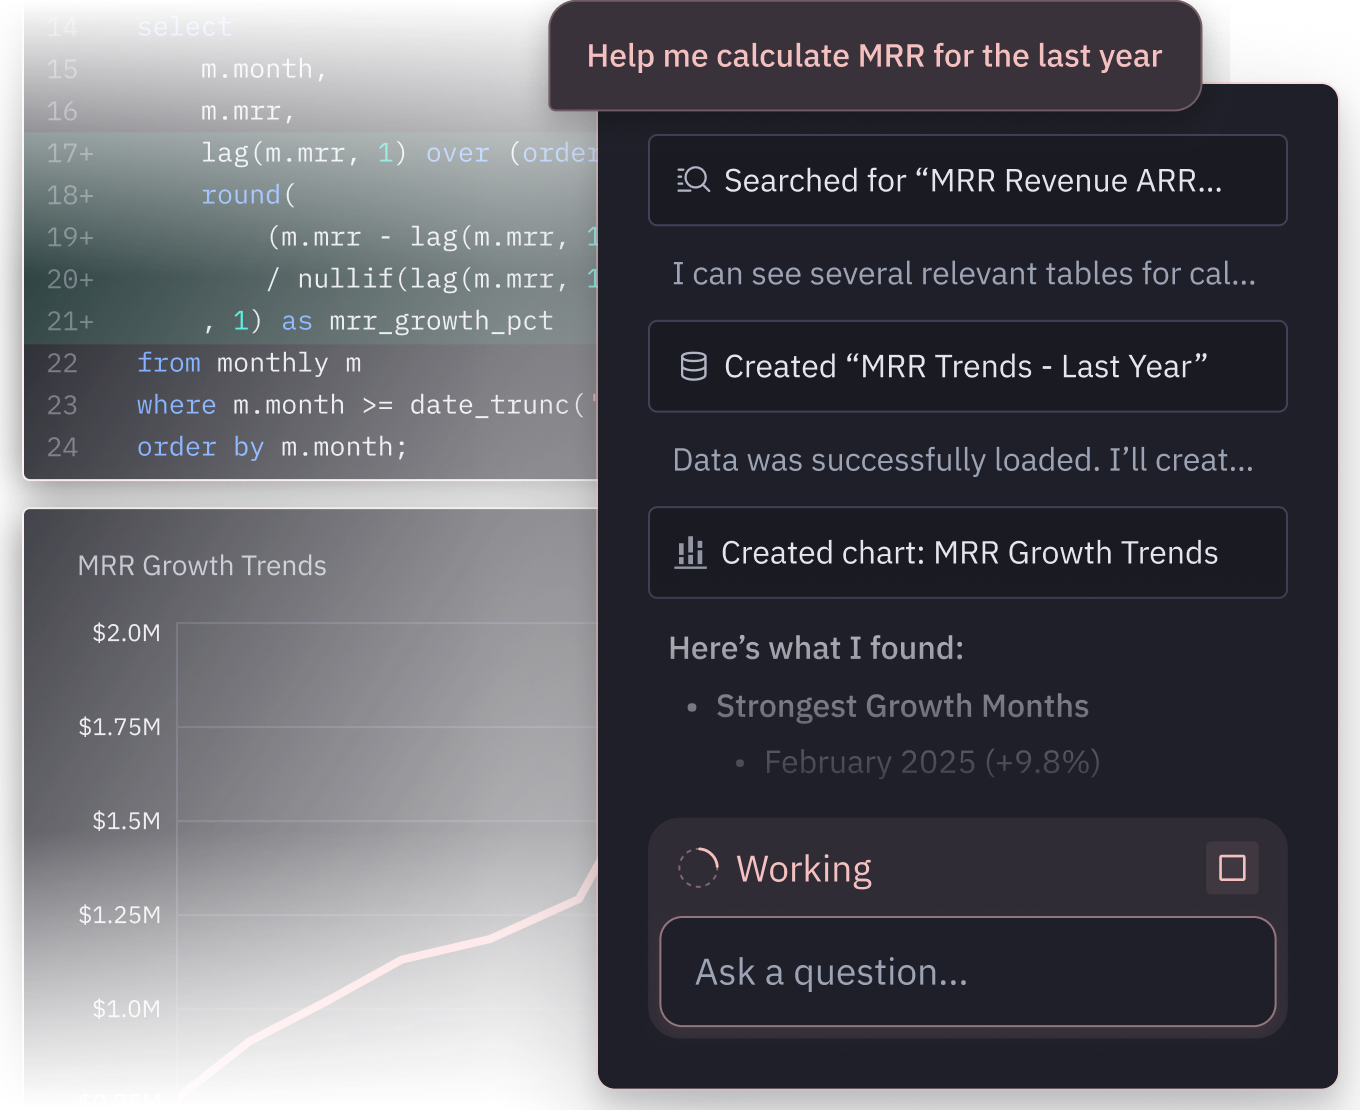
Hex is flexible: build models in Hex or sync them from dbt, Snowflake, or Cube. When questions go beyond the model, explore freely with agentic notebooks, without switching tools.
| Features | Hex | Looker |
|---|---|---|
Ad hoc exploration Explore unmodeled data freely, all in one place | Hex Explore frontier questions and new data with SQL, Python, and no-code, all in one environment. | Looker Exploration is limited to what’s already modeled; you can’t freely query new tables or run code-based analysis. |
Interoperable modeling Use or sync models from multiple sources | Hex Build models in Hex or sync semantic definitions from dbt, Snowflake, or Cube. | Looker Logic must be defined in LookML; no support for importing or syncing external semantic layers. |
AI-assisted model creation Jumpstart models using existing project context | Hex Modeling Agent can reference existing notebooks, queries, and assets to bootstrap new semantic models with natural language. | Looker Gemini can generate LookML, but cannot reference existing analyses as context for new models. |
Unify the full cycle of data work with Hex.
Leave disconnected workflows behind.
Compounding accuracy
- Deep analysis
Explore the new, novel, and gnarly
- Trusted context
Semantic models, reusable components, and interactive data apps.
- Conversational self-serve
Start with a prompt, get to a first draft in minutes, and iterate with full control.
Hear from data teams that chose Hex
Learn how the best companies in the world answer more questions with data using Hex.


FAQ
- Explore unmodeled data using SQL, Python, and no-code together in reactive notebooks.
- Ask and iterate in plain language with Threads, without needing to understand modeling concepts in LookML or Explores.
- Turn advanced analysis into an interactive data apps powered by live notebook logic.
- Work in one connected workspace, so exploration, iteration, and sharing stay in sync.
Hex is built to help data teams and non-technical users find more answers from data, faster. Non-technical users have quick, approachable ways to engage with data, interacting with curated data apps, exploring with no-code tools (spreadsheets, pivot tables, drag & drop) or asking questions in plain language through Threads.
Meanwhile, data teams have the full depth of SQL, Python, and AI for technical work. Because everyone works in the same workspace, stakeholders get answers faster and data teams don’t have to recreate analysis across multiple tools.
BI dashboards are built to show what happened—fixed KPIs and standard cuts of the data. Hex is built to answer how it happened, why it happened, and what if it changes. With data-team-first workflows in a notebook that supports SQL, Python, and no-code, teams can move quickly from simple KPI lookups to deep, iterative analysis, without bouncing between tools.
Business questions come in all shapes and forms. Sometimes it’s a simple KPI trend, other times it’s “why is this happening?” or “what can we expect next?”, which requires deeper analysis. Splitting BI and technical analysis across different tools creates friction, duplicate effort, and inconsistent answers. Hex unifies it all in one place so the workflow stays connected.
Yes. Hex supports traditional dashboards, but also goes further, letting teams build interactive data apps, parameterized views, and even workflows with predictive models. That flexibility means you can cover executive reporting and deeper analysis in the same place, instead of maintaining separate tools.
Yes. Hex lets users self-serve insights with natural language Q&A, interactive charts, pivot tables, spreadsheet-style views, and simple formula-based calculations—all without writing SQL or Python.
Hex takes an interoperable approach to semantic models, giving you the flexibility to build directly in Hex or sync from other sources. Building in Hex lets you define and edit models right where you already work with data—with autocomplete, inline validation, and AI-assisted code generation in the modeling workbench.
Alternatively, you can sync existing semantic models from dbt, Snowflake, or Cube. Either way, your semantic models live alongside notebooks, self-serve, and agents, ensuring governed, reusable logic powers every workflow.
Anyone can sign up for a free 14-day trial of Hex's Team plan. If you'll require more time to evaluate Hex or are curious about our Enterprise plan, please reach out and we'll get you set up!
Can't find your answer here? Get in touch.